Rennova Health Stock Forecast
Explanation to Bollinger's Bands
Bollinger Bands was created by John Bollinger in the early 1980s, its purpose is to define price action relative to the assets highs and lows. This technical indicator is used to identify buy and sell signals and has proven very well in doing so.
Bollinger Bands consist of a set of three curves drawn in relation to securities prices. The middle band is a measure of the intermediate-term trend, usually a simple moving average, that serves as the base for the upper and lower bands. The interval between the upper and lower bands and the middle band is determined by volatility, typically the standard deviation of the same data that were used for the average. StockInvest.us uses Bollingers suggested 20 day average.
Middle Bollinger Band = 20-period simple moving average
Upper Bollinger Band = Middle Bollinger Band + 2 * 20-period standard deviation
Lower Bollinger Band = Middle Bollinger Band - 2 * 20-period standard deviation
BandWidth defines the current width of the band.
%b defines the current position within the band.
BandWidth = (Upper Bollinger Band - Lower Bollinger Band) / Middle Bollinger Band
%b = (Last - Lower Bollinger Band) / (Upper Bollinger Band - Lower Bollinger Band)
Live Samples:
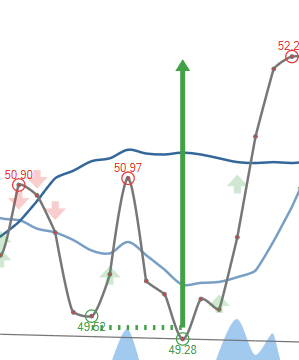
Bottlenecks in bandwidth indicate an upcoming change. Break up through the moving average line or continuous movements above the moving average line indicate a break up, and vice versa.
Source: http://www.bollingerbands.com
Big movements in Rennova Health stock price on Friday moving 100.00% between high and low
(Updated on Feb 07, 2020)
No changes to the price of Rennova Health stock on the last trading day (Friday, 7th Feb 2020). During the last trading day the stock fluctuated 100.00% from a day low at $0.00005 to a day high of $0.0001. The price has been going up and down for this period, and there has been a 0% change for the last 2 weeks.
Given the current horizontal trend, you can expect Rennova Health stock with a 90% probability to be traded between $0.0001 and $0.0001 at the end of this 3-month period. A break of a horizontal trend is often followed by a large increase in the volume, and stocks seldom manage to go directly from the bottom of a trend up to the top. Stocks turning up in the middle of a horizontal trend are therefore considered to be potential runners.
Ready to grow your portfolio? Here's your beginner's guide to opening a free brokerage account.
RNVA Signals & Forecast
A buy signal was issued from a pivot bottom point on Thursday, February 06, 2020, and so far it has fallen 0%. Further rise is indicated until a new top pivot has been found. Volume gained on the last day while the price remained unchanged. This is not a classical divergence, but the stock should be watched more closely at it may be a "turning point". The very low volume increases the risk and reduces the other technical signals issued.
Support, Risk & Stop-loss for Rennova Health stock
There is no support from accumulated volume below today's level and given the right condition the stock may perform very badly in the next couple of days.
In general the stock tends to have very controlled movements and with good liquidity the risk is considered very low in this stock. During the last day, the stock moved $0.00005 between high and low, or 100.00%. For the last week the stock has had daily average volatility of 20.00%.
Our recommended stop-loss: $0.000094 (-6.00%) (This stock has low daily movements and this gives low risk. There is a buy signal from a pivot bottom found 1 day ago.)
Trading Expectations (RNVA) For The Upcoming Trading Day Of Monday 10th
For the upcoming trading day on Monday, 10th we expect Rennova Health to open at $0.00008333, and during the day (based on 14 day Average True Range), to move between $0.00007845 and $0.0001, which gives a possible trading interval of +/-$0.00002155 (+/-21.55%) up or down from last closing price. If Rennova Health takes out the full calculated possible swing range there will be an estimated 43.10% move between the lowest and the highest trading price during the day.
Is Rennova Health stock A Buy?
Rennova Health holds several positive signals, but we still don't find these to be enough for a buy candidate. At the current level, it should be considered as a hold candidate (hold or accumulate) in this position whilst awaiting further development.
Current score: 0.969 Hold/Accumulate Unchanged
Predicted Opening Price for Rennova Health of Monday, February 10, 2020
| Fair opening price February 10, 2020 | Current price |
|---|---|
| $0.00008333 ( 16.67%) | $0.0001 |
The predicted opening price is based on yesterday's movements between high, low, and closing price.
Trading levels for RNVA
Fibonacci Support & Resistance Levels
| Level | Price | |||
|---|---|---|---|---|
| Resistance | R3 | 0.0001 | 33.33 % | |
| R2 | 0.0001 | 14.23 % | ||
| R1 | 0.0001 | 2.43 % | ||
| Current price: | 0.0001 | |||
| Support | S1 | 0.00006423 | -35.77 % | |
| S2 | 0.00005243 | -47.57 % | ||
| S3 | 0.00003333 | -66.67 % |
Accumulated Volume Support & Resistance Levels
| Level | Price | |||
|---|---|---|---|---|
| Resistance | R3 | 0 | . | |
| R2 | 0 | . | ||
| R1 | 0 | . | ||
| Current price | 0.0001 | |||
| Support | S1 | 0 | . | |
| S2 | 0 | . | ||
| S3 | 0 | . |
FAQ
Click here for our free guide on how to buy Rennova Health Stock.