Vertu Motors Plc Stock Forecast
Vertu Motors Plc stock price ended at £67.80 on Thursday, after losing 1.74%.
(Updated on Apr 25, 2024)
The Vertu Motors Plc stock price fell by -1.74% on the last day (Thursday, 25th Apr 2024) from £69.00 to £67.80. During the last trading day the stock fluctuated 4.48% from a day low at £67.00 to a day high of £70.00. The price has been going up and down for this period, and there has been a -1.17% loss for the last 2 weeks. Volume fell on the last day along with the stock, which is actually a good sign as volume should follow the stock. On the last day, the trading volume fell by -262 thousand shares and in total, 163 thousand shares were bought and sold for approximately £11.02 million.
The stock lies in the middle of a wide and weak rising trend in the short term and a further rise within the trend is signaled. Given the current short-term trend, the stock is expected to rise 4.20% during the next 3 months and, with a 90% probability hold a price between £67.61 and £74.69 at the end of this 3-month period.
Ready to grow your portfolio? Here's your beginner's guide to opening a free brokerage account.
VTU.L Signals & Forecast
The Vertu Motors Plc stock holds buy signals from both short and long-term Moving Averages giving a positive forecast for the stock, but the stock has a general sell signal from the relation between the two signals where the long-term average is above the short-term average. On corrections down, there will be some support from the lines at £66.87 and £67.02. A breakdown below any of these levels will issue sell signals. Some negative signals were issued as well, and these may have some influence on the near short-term development. A sell signal was issued from a pivot top point on Wednesday, April 24, 2024, and so far it has fallen -1.74%. Further fall is indicated until a new bottom pivot has been found. Furthermore, there is currently a sell signal from the 3 month Moving Average Convergence Divergence (MACD). Volume fell together with the price during the last trading day and this reduces the overall risk as volume should follow the price movements.
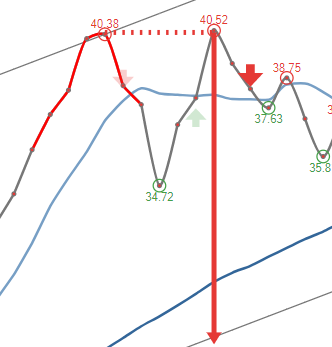 A sell signal from a double top formation was found on Tuesday, April 09, 2024 and based on theory for this formation the price should fall by -8.65% to £61.93 within 24 trading days since signal was issued (Friday, April 26, 2024).
Support, Risk & Stop-loss for Vertu Motors Plc stock
Vertu Motors Plc finds support from accumulated volume at £67.70 and this level may hold a buying opportunity as an upwards reaction can be expected when the support is being tested.
This stock is usually traded at a good volume, and with minor daily changes, the risk is considered to be low. During the last day, the stock moved £3.00 (4.48%) between high and low. For the last week, the stock has had daily average volatility of 4.73%.
Our recommended stop-loss: £64.64 (-4.66%) (This stock has low daily movements and this gives low risk. There is a sell signal from a pivot top found 1 day ago.)
Trading Expectations (VTU.L) For The Upcoming Trading Day Of Friday 26th
For the upcoming trading day on Friday, 26th we expect Vertu Motors Plc to open at £68.27, and during the day (based on 14 day Average True Range), to move between £65.01 and £70.59, which gives a possible trading interval of +/-£2.79 (+/-4.11%) up or down from last closing price. If Vertu Motors Plc takes out the full calculated possible swing range there will be an estimated 8.22% move between the lowest and the highest trading price during the day.
Since the stock is closer to the support from accumulated volume at £67.70 (0.15%) than the resistance at £68.60 (1.18%), our systems sees the trading risk/reward intra-day as attractive and believe profit can be made before the stock reaches first resistance..
Is Vertu Motors Plc stock A Buy?
Vertu Motors Plc holds several positive signals, but we still don't find these to be enough for a buy candidate. At the current level, it should be considered as a hold candidate (hold or accumulate) in this position whilst awaiting further development.
Current score: -0.682 Hold/Accumulate Unchanged
Predicted Opening Price for Vertu Motors Plc of Friday, April 26, 2024
| Fair opening price April 26, 2024 | Current price |
|---|---|
| £68.27 ( 0.688%) | £67.80 |
The predicted opening price is based on yesterday's movements between high, low, and closing price.
Trading levels for VTU.L
Fibonacci Support & Resistance Levels
| Level | Price | |||
|---|---|---|---|---|
| Resistance | R3 | 71.27 | 5.11 % | |
| R2 | 70.12 | 3.42 % | ||
| R1 | 69.41 | 2.38 % | ||
| Current price: | 67.80 | |||
| Support | S1 | 67.12 | -1.00 % | |
| S2 | 66.41 | -2.05 % | ||
| S3 | 65.27 | -3.74 % |
Accumulated Volume Support & Resistance Levels
| Level | Price | |||
|---|---|---|---|---|
| Resistance | R3 | 70.00 | 3.24 % | |
| R2 | 69.90 | 3.10 % | ||
| R1 | 68.60 | 1.18 % | ||
| Current price | 67.80 | |||
| Support | S1 | 67.70 | -0.147% | |
| S2 | 65.70 | -3.10% | ||
| S3 | 64.60 | -4.72% |
VTU Dividend Payout History
| # | Ex-Date | Pay Date | Amount | Yield | |
|---|---|---|---|---|---|
| 1 | Dec 14, 2023 | Dec 14, 2023 | Dec 14, 2023 | £0 | 0% |
| 2 | Jun 29, 2023 | Jun 29, 2023 | Jun 29, 2023 | £1.45 | 2.09% |
| 3 | Oct 05, 2022 | Dec 15, 2022 | Jan 20, 2023 | £0.700 | 1.23% |
| 4 | May 11, 2022 | Jun 30, 2022 | Jul 29, 2022 | £1.05 | 1.79% |
| 5 | Oct 13, 2021 | Dec 16, 2021 | Jan 21, 2022 | £0.650 | 1.01% |
FAQ
Click here for our free guide on how to buy Vertu Motors Plc Stock.