Willis Lease Finance Corporation Stock Forecast
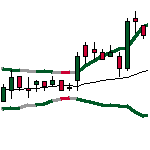
Explanation to Bollinger's Bands
Bollinger Bands was created by John Bollinger in the early 1980s, its purpose is to define price action relative to the assets highs and lows. This technical indicator is used to identify buy and sell signals and has proven very well in doing so.
Bollinger Bands consist of a set of three curves drawn in relation to securities prices. The middle band is a measure of the intermediate-term trend, usually a simple moving average, that serves as the base for the upper and lower bands. The interval between the upper and lower bands and the middle band is determined by volatility, typically the standard deviation of the same data that were used for the average. StockInvest.us uses Bollingers suggested 20 day average.
Middle Bollinger Band = 20-period simple moving average
Upper Bollinger Band = Middle Bollinger Band + 2 * 20-period standard deviation
Lower Bollinger Band = Middle Bollinger Band - 2 * 20-period standard deviation
BandWidth defines the current width of the band.
%b defines the current position within the band.
BandWidth = (Upper Bollinger Band - Lower Bollinger Band) / Middle Bollinger Band
%b = (Last - Lower Bollinger Band) / (Upper Bollinger Band - Lower Bollinger Band)
Live Samples:
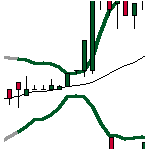
Bottlenecks in bandwidth indicate an upcoming change. Break up through the moving average line or continuous movements above the moving average line indicate a break up, and vice versa.
Source: http://www.bollingerbands.com
Strong day for Willis Lease Finance Corporation stock price on Friday rising 7.06% to $55.99
(Updated on May 03, 2024)
The Willis Lease Finance Corporation stock price gained 7.06% on the last trading day (Friday, 3rd May 2024), rising from $52.30 to $55.99. It has now gained 4 days in a row. It will be exciting to see whether it manages to continue gaining or take a minor break for the next few days. During the last trading day the stock fluctuated 6.95% from a day low at $52.35 to a day high of $55.99. The price has been going up and down for this period, and there has been a 12.23% gain for the last 2 weeks. Volume has increased on the last day along with the price, which is a positive technical sign, and, in total, 10 thousand more shares were traded than the day before. In total, 26 thousand shares were bought and sold for approximately $1.48 million.
The stock has broken the weak rising the short-term trend up and an even stronger rate of rising is indicated. For any reaction back there will now be support on the roof on the current trend broken at $52.30, a level that may pose a second chance to hit a runner. According to fan-theory $56.17 will be the next possible trend-top level and thereby pose a resistance level that may not be broken at the first attempt.
Ready to grow your portfolio? Here's your beginner's guide to opening a free brokerage account.
WLFC Signals & Forecast
The Willis Lease Finance Corporation stock holds buy signals from both short and long-term Moving Averages giving a positive forecast for the stock. Also, there is a general buy signal from the relation between the two signals where the short-term average is above the long-term average. On corrections down, there will be some support from the lines at $50.32 and $49.62. A breakdown below any of these levels will issue sell signals. A buy signal was issued from a pivot bottom point on Monday, April 29, 2024, and so far it has risen 15.92%. Further rise is indicated until a new top pivot has been found. Furthermore, there is a buy signal from the 3 month Moving Average Convergence Divergence (MACD). Willis Lease Finance Corporation has increased volume and follows the last lift in the price. This is considered to be a technical positive sign as volume should follow the price-formation. Higher liquidity also reduces the general risk.
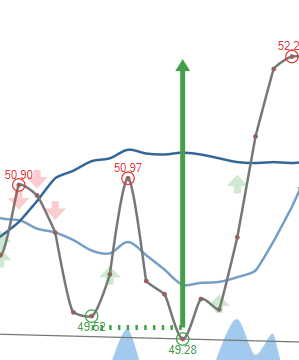 A buy signal from a double bottom formation was found on Tuesday, March 12, 2024 with a target of $49.31. Despite whether the objective of the signal formation has been reached the stock may continue to perform well.
Support, Risk & Stop-loss for Willis Lease Finance Corporation stock
On the downside, the stock finds support just below today's level from accumulated volume at $50.36 and $49.89. There is a natural risk involved when a stock is testing a support level, since if this is broken, the stock then may fall to the next support level. In this case, Willis Lease Finance Corporation finds support just below today's level at $50.36. If this is broken, then the next support from accumulated volume will be at $49.89 and $48.29.
In general the stock tends to have very controlled movements and with good liquidity the risk is considered very low in this stock. During the last day, the stock moved $3.64 between high and low, or 6.95%. For the last week the stock has had daily average volatility of 3.80%.
Our recommended stop-loss: $54.04 (-3.48%) (This stock has low daily movements and this gives low risk. There is a buy signal from a pivot bottom found 4 days ago.)
Trading Expectations (WLFC) For The Upcoming Trading Day Of Monday 6th
For the upcoming trading day on Monday, 6th we expect Willis Lease Finance Corporation to open at $54.78, and during the day (based on 14 day Average True Range), to move between $54.57 and $57.41, which gives a possible trading interval of +/-$1.42 (+/-2.54%) up or down from last closing price. If Willis Lease Finance Corporation takes out the full calculated possible swing range there will be an estimated 5.07% move between the lowest and the highest trading price during the day.
With no resistance above and support from accumulated volume @ $50.36, some $5.63 (10.06%) from the current price of $55.99, our system finds the risk reward attractive.
Is Willis Lease Finance Corporation stock A Buy?
Willis Lease Finance Corporation holds several positive signals, but we still don't find these to be enough for a buy candidate. At the current level, it should be considered as a hold candidate (hold or accumulate) in this position whilst awaiting further development.
Current score: 0.000 Hold/Accumulate Unchanged
Zero in score indicates that our system is expecting high volatility and risk for the following trading day. Given the latest developments, we cannot determine the next direction as it may go both ways.
Predicted Opening Price for Willis Lease Finance Corporation of Monday, May 6, 2024
| Fair opening price May 6, 2024 | Current price |
|---|---|
| $54.78 ( 2.17%) | $55.99 |
The predicted opening price is based on yesterday's movements between high, low, and closing price.
Trading levels for WLFC
Fibonacci Support & Resistance Levels
| Level | Price | |||
|---|---|---|---|---|
| Resistance | R3 | 58.42 | 4.33 % | |
| R2 | 57.03 | 1.85 % | ||
| R1 | 56.17 | 0.316 % | ||
| Current price: | 55.99 | |||
| Support | S1 | 53.39 | -4.65 % | |
| S2 | 52.53 | -6.18 % | ||
| S3 | 51.14 | -8.67 % |
Accumulated Volume Support & Resistance Levels
| Level | Price | |||
|---|---|---|---|---|
| Resistance | R3 | 0 | . | |
| R2 | 0 | . | ||
| R1 | 0 | . | ||
| Current price | 55.99 | |||
| Support | S1 | 50.36 | -10.06% | |
| S2 | 49.89 | -10.89% | ||
| S3 | 48.29 | -13.75% |
FAQ
Click here for our free guide on how to buy Willis Lease Finance Corporation Stock.