Double Tops - 3 Months
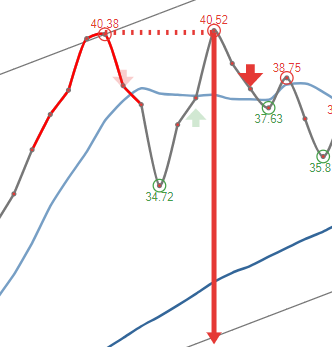 Double tops are well know technical chart patterns. However, there is a slight disagreement about how and where it should be drawn. The length of the red arrow represents the potential fall from the date issued in the signal. Nonetheless, there is a possibility it may perform better or may not perform at all. We recommend you to be alert at all times. A buy or a sell candidate is an automated opinion about the ticker at the end of the last trading day. The score is based on technical analysis and our algorithms. It does not constitute as an offer to buy or sell the securities.
2024-06-24 3.20
$58.48 -0.120%
2024-06-18 3.11
$50.47 0.0790%
2024-06-24 3.11
$84.13 0.97%
2024-06-24 3.10
$56.83 1.00%
2024-06-24 3.10
$21.93 0.97%
2024-06-24 3.10
$52.99 0.95%
2024-06-25 3.03
₹200.15 1.45%
2024-06-19 2.93
$7,354.00 -0.244%
2024-06-20 2.93
$8.71 -0.684%
2024-06-25 2.92
$50.14 0.0200%
2024-06-24 2.88
$467.13 0.0300%
2024-06-26 2.63
$63.91 -0.219%
2024-06-24 2.63
$145.87 -0.164%
2024-04-23 2.34
42.58€ -0.0940%
2024-06-21 2.21
$40.44 0.0120%
2024-06-25 2.11
$49.98 0.100%
2024-06-24 2.11
$25.12 0.0400%
2024-05-27 2.03
54.40€ 0.517%
2024-05-27 2.03
54.40€ 0.517%
Enhance Your trading strategy with
Custom Stock Screeners. Build Yours now!
2024-06-18 6.12
$67.57 1.02%
#### - Click To Unlock
Sector: Real Estate Industry: REIT—Healthcare Facilities Exchange: NYSE Instrument: Stock