Buy Signal
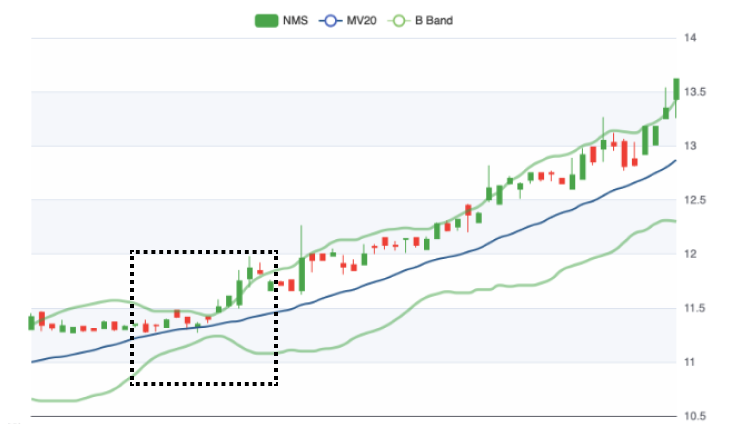
Bollinger Breakout Upwards
(Updated 14 hours ago)
This list highlights breakout signals from Bollinger Bands bottleneck formations, a popular trading tool for identifying overbought and oversold conditions. While Bollinger Bands can provide valuable insights, it's important to consider other factors alongside them for a more comprehensive trading strategy.
#11
Medium Risk
2026-06-24
6.94
$47.26
1.00%
#12
Medium Risk
2026-06-24
4.92
$74.49
3.54%
#13
Low Risk
2026-06-24
0.00
$47.62
1.32%
#14
Medium Risk
2026-06-24
5.85
$45.50
0.331%
#15
Very Low Risk
2026-06-24
0.96
$295.82
1.53%
#16
Very Low Risk
2026-06-24
0.64
$32.46
0.402%
#17
Medium Risk
2026-06-24
0.00
$31.47
1.09%
#18
Very Low Risk
2026-06-24
-0.79
$54.02
2.19%
#19
Low Risk
2026-06-24
4.16
$53.17
0.739%
#20
Very Low Risk
2026-06-24
1.72
$10.43
-0.0010%
#21
Low Risk
2026-06-24
6.54
$8.39
1.21%
#22
Medium Risk
2026-06-24
0.00
$33.57
1.54%
#23
Very Low Risk
2026-06-24
4.66
$48.57
0.259%
#24
Medium Risk
2026-06-24
6.54
$40.36
1.03%
#25
Low Risk
2026-06-24
2.21
$29.98
4.10%
Enhance Your trading strategy with
Custom Stock Screeners. Build Yours now!
Trusted Broker
Start Your Journey With:

0% Commission Stock Trading
Follow Other Investors Strategy
Wide variety: Crypto, stocks, ETFs