Double Bottoms - 3 Months
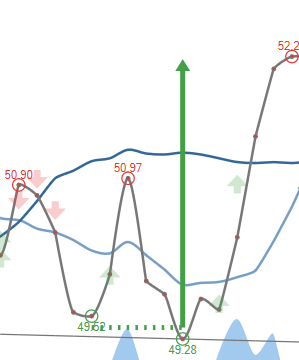 Double bottoms are well know technical chart patterns. However, there is a slight disagreement about how and where it should be drawn. The length of the green arrow represents the potential found in the signal. Nonetheless, there is a possibility it may perform better or may not perform at all. We recommend you to be alert at all times. A buy or a sell candidate is an automated opinion about the ticker at the end of the last trading day. The score is based on technical analysis and our algorithms. It does not constitute as an offer to buy or sell the securities.
#127
2024-03-18 4.90
20.45€ 0.393%
#128
2024-03-18 4.90
20.45€ 0.393%
#129
2024-03-18 -3.49
$16,453.00 -1.21%
#130
2024-03-15 0.00
HK$17.68 0.341%
#131
2024-03-15 -4.27
$15.47 -5.61%
#132
2024-03-14 0.00
₩8,930.00 1.36%
#133
2024-03-13 -5.28
JP¥2,907.00 -0.309%
#135
2024-03-12 5.54
$103.94 0.688%
#136
2024-03-11 0.00
$45.40 0.93%
#137
2024-03-06 0.00
TRY 69.25 3.59%
#138
2024-03-05 2.53
$1,650.00 0.610%
#139
2024-03-05 7.22
$97.60 0.350%
#140
2024-03-05 -1.71
R$12.72 0.157%
#141
2024-03-01 5.04
$96.82 0.0830%
#142
2024-03-01 5.35
$35.65 0.678%
#143
2024-02-29 -0.26
$49.00 4.26%
#144
2024-02-28 1.57
$30.81 0.358%
Enhance Your trading strategy with
Custom Stock Screeners. Build Yours now!
2024-03-18 2.82
$138.67 1.01%
ARES - Ares Management LP
Sector: Financial Services Industry: Asset Management Exchange: NYSE Instrument: Stock